GPU Programming, Machine Learning, and Systems Portfolio

Damian Saelee

Computer Science Student | GPU Programming | Machine Learning | Performance Engineering

I build performance-oriented software and technical projects with a strong emphasis on CUDA, PyTorch, multiplayer systems, and profiling. My work is driven by implementation details, measurement, and practical results rather than vague optimization claims.

About

Technical, hands-on, and metrics-driven.

I am a Computer Science student who enjoys building performance-oriented software across GPU computing, machine learning systems, multiplayer game architecture, and systems-oriented development. I am especially interested in work that involves profiling, identifying bottlenecks, and improving throughput instead of stopping once something merely runs.

What I like working on

GPU acceleration, ML training and inference pipelines, systems-level optimization, multiplayer architecture, and software that benefits from careful measurement.

Engineering approach

I design and build systems around clear requirements, then profile bottlenecks, make targeted improvements, and validate the result with timing data, traces, or throughput measurements.

Core technical toolkit

C++, Python, C#, CUDA, PyTorch, Unity, NVIDIA Nsight Systems, NVTX, Docker, Git, and supporting ML/data tooling.

Projects

Projects built around implementation details and measurable results.

Selected projects focused on performance, systems design, and measurable engineering results.

Project 01

CUDA-Accelerated Mandelbrot Renderer

374 ms -> 1.0 ms frame time with Nsight-validated ~370x speedup

CUDA Mandelbrot renderer with smooth deep-zoom support, Nsight and NVTX profiling, and a measured ~370x speedup over the single-threaded CPU path.

Built a Mandelbrot renderer in C++ and CUDA that maps pixels independently across the GPU, enabling smooth real-time zooming and deeper fractal renders without the frame stalls of the original CPU path.

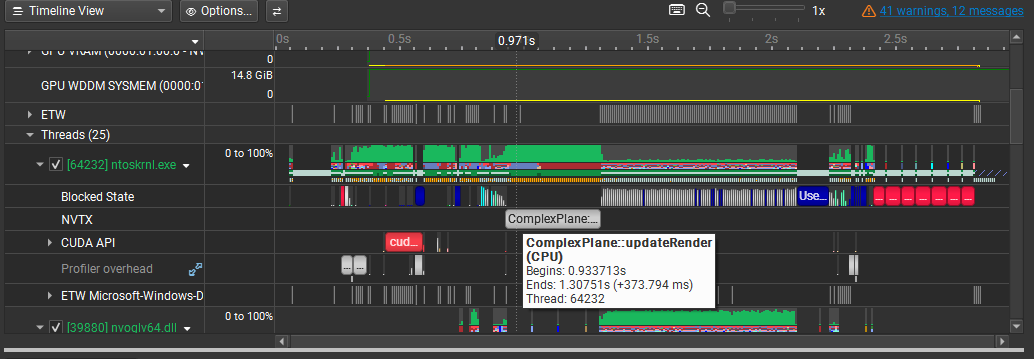
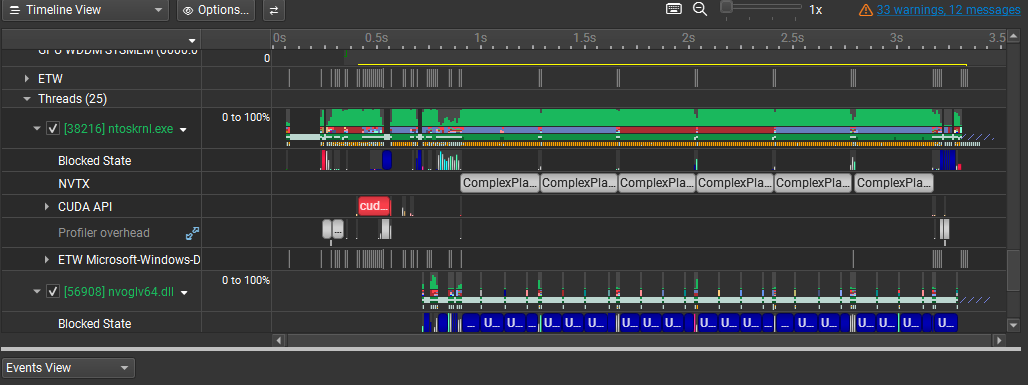
Instrumented the render loop with NVIDIA Nsight Systems and NVTX markers to trace both CPU and GPU execution. Profiling exposed a state-management bug where ComplexPlane::updateRender() kept rerunning because the app failed to transition from CALCULATING to DISPLAYING, causing unnecessary recomputation every frame.

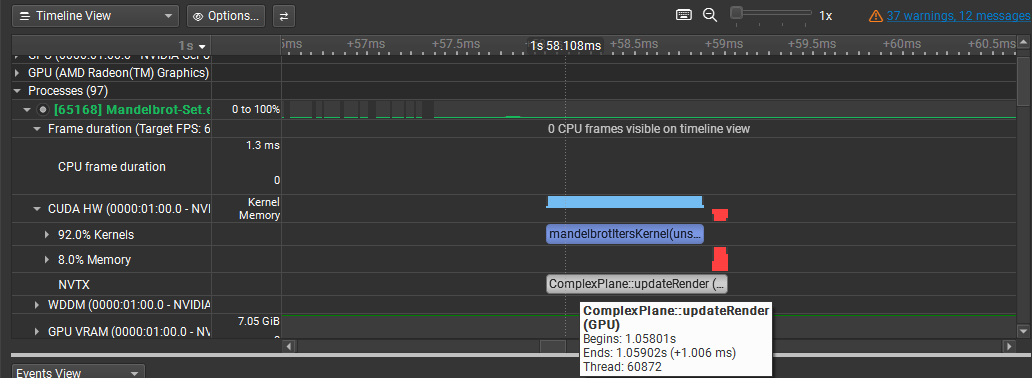
After fixing the render-state transition and validating the CUDA path, full-frame time dropped from about 374 ms on CPU to about 1.0 ms on GPU, with the Mandelbrot kernel taking about 0.87 ms and the remaining ~0.13 ms spent in CPU-side post-processing and vertex/color updates. The project emphasizes parallel work distribution, profiling-led debugging, and measurable throughput gains backed by traces.

  • Distributed per-pixel escape-time computation across the GPU for parallel fractal generation
  • Used Nsight Systems and NVTX to isolate redundant recomputation in the render loop
  • Quantified remaining CPU-side post-processing after the kernel to guide next optimizations
  • C++
  • CUDA
  • SFML
  • NVIDIA Nsight Systems
  • NVTX
Profiler evidence Nsight Systems traces for render-state bug and CPU/GPU timing
Nsight Systems timeline showing repeated executions of ComplexPlane updateRender caused by failing to transition from CALCULATING to DISPLAYING.
Trace issue Repeated updateRender calls from a state-transition bug Nsight Systems timeline showing repeated executions of ComplexPlane::updateRender() caused by failing to transition from CALCULATING to DISPLAYING. The missing state update resulted in unnecessary recomputation each render loop iteration.
Nsight Systems timing view for ComplexPlane updateRender on the CPU showing about 374 milliseconds for a single full-frame Mandelbrot computation.
CPU path CPU timing: ~374 ms per full-frame render Nsight Systems timing of ComplexPlane::updateRender() executed on the CPU. The function takes about 374 ms for a single full-frame Mandelbrot computation.
Nsight Systems timing view for ComplexPlane updateRender on the GPU showing about 1.0 milliseconds total with roughly 0.87 milliseconds in the CUDA kernel.
GPU path GPU timing: ~1.0 ms total with ~0.87 ms in the CUDA kernel Nsight Systems timing of ComplexPlane::updateRender() executed on the GPU. The total per-frame execution time is ~1.0 ms, with the Mandelbrot CUDA kernel accounting for ~0.87 ms. The remaining ~0.13 ms is spent in a single-threaded CPU loop responsible for post-processing and vertex/color updates, indicating potential for further optimization by reducing CPU-side work.

Project 02

GPU-Accelerated Pokémon Card Classifier

199.871 s -> 66.714 s 5-epoch runtime after end-to-end pipeline tuning

End-to-end ML systems project combining asynchronous dataset collection, label normalization, ResNet-18 fine-tuning, and Nsight-driven throughput optimization.

Built a Pokémon card image classification pipeline in Python using PyTorch, Torchvision, and CUDA, with asynchronous dataset collection through TCGdex and aiohttp plus automated train/validation/test organization.

Added label normalization to collapse noisy card names and card-specific variants into base Pokémon identities, which kept the supervised dataset more consistent and reduced label noise during training.

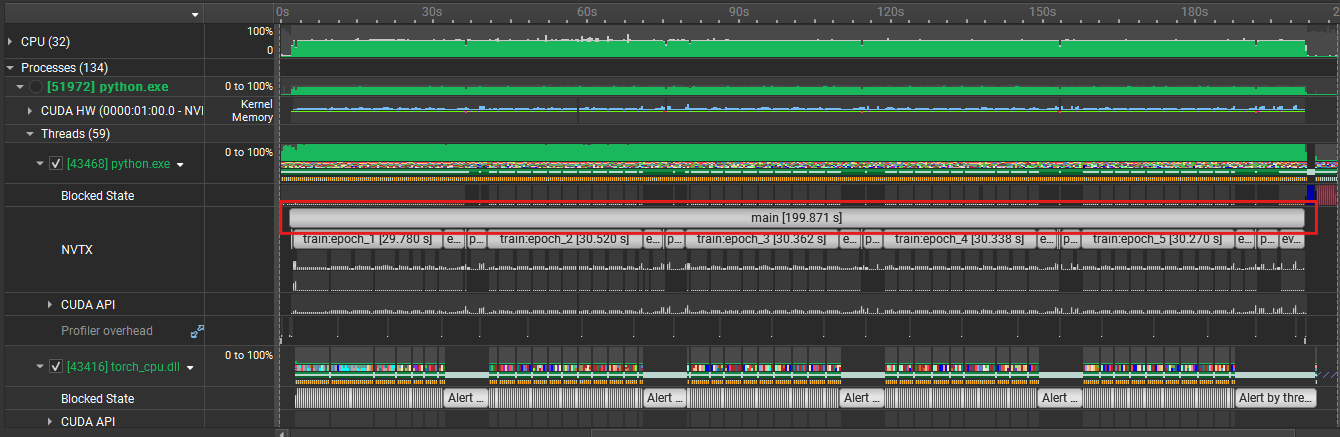
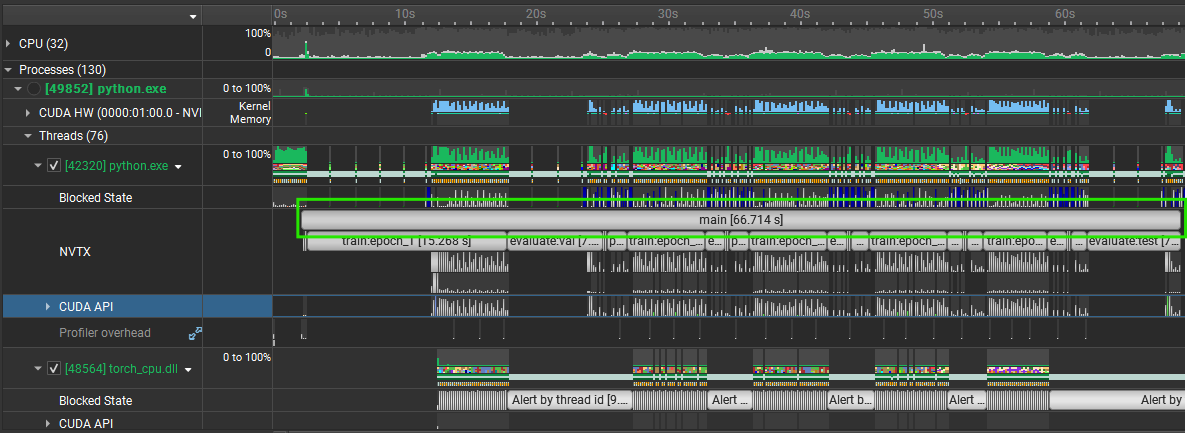
Profiled GPU execution and CPU-side input stalls with NVIDIA Nsight Systems and NVTX markers, then tuned the DataLoader pipeline instead of treating model code as the only bottleneck. The final 5-epoch run dropped from 199.871 s to 66.714 s, a 66.6% runtime reduction and roughly 3.0x speedup driven by better worker settings, persistent workers, pinned memory, non-blocking transfers, and `prefetch_factor=4`.

  • Collected card images asynchronously with TCGdex and aiohttp
  • Normalized labels like card variants into base Pokémon identities
  • Used Nsight Systems plus NVTX to tune DataLoader throughput, not just model code
  • Python
  • PyTorch
  • Torchvision
  • CUDA
  • asyncio
  • aiohttp
  • TCGdex API / SDK
  • NVIDIA Nsight Systems
  • NVTX
Profiler evidence Nsight Systems baseline vs optimized training runs
Nsight Systems timeline for the baseline Pokemon card classifier training run showing a total runtime of about 199.871 seconds.
Baseline 5-epoch training run: 199.871 s Original pipeline before DataLoader and transfer tuning.
Nsight Systems timeline for the optimized Pokemon card classifier training run showing a total runtime of about 66.714 seconds.
Optimized 5-epoch training run: 66.714 s Tuned workers, pinned memory, non-blocking transfers, and prefetching.

Project 03

Multiplayer Zombie RTS / Survival Game

Server-authoritative NGO + PlayFab/Azure flow with zombie LOD scaling for 300+ enemies

Server-authoritative Unity co-op survival project with dedicated server orchestration, PlayFab and Azure matchmaking flow, and LOD-based zombie synchronization for large AI counts.

Built a top-down co-op zombie survival and extraction game in Unity using Netcode for GameObjects, centered on server-authoritative gameplay where clients send inputs via ServerRpc and receive replicated state through NetworkVariables and ClientRpc.

Extended the project beyond local multiplayer by wiring a dedicated server flow through PlayFab login and matchmaking, an Azure Function that hides public API keys and allocates servers, and a Dockerized PlayFab server build managed through GSDK lifecycle callbacks and NGO startup.

Focused heavily on simulation cost and network overhead. A custom ZombieSyncManager applies a 3-tier LOD strategy that reduces AI update frequency and disables NetworkTransform for distant zombies, helping the game scale to 300+ zombies while profiling at about 0.15 ms for 203 simultaneous zombies. Server testing on a 2 vCPU PlayFab VM ran at roughly 18% CPU and ~300 MB memory with 300 zombies active.

  • Implemented server-authoritative units, projectiles, damage, and zombie AI
  • Built a PlayFab plus Azure Functions allocation path for dedicated multiplayer servers
  • Optimized AI and sync cost with a 3-tier zombie LOD system for large enemy counts
  • Unity
  • C#
  • Netcode for GameObjects
  • PlayFab Multiplayer Servers
  • PlayFab GSDK
  • Docker
  • Azure Functions
Architecture snapshot Dedicated server flow, gameplay authority, and scale-focused systems design
Players + PlayFab login and matchmaking Dedicated Unity NGO server with server-authoritative simulation Azure Function allocation plus PlayFab Multiplayer Servers
ServerRpc, ClientRpc, and NetworkVariables drive authoritative gameplay sync ZombieSyncManager LOD tiers reduce AI and network cost as zombie counts rise Dockerized server builds integrate with the PlayFab GSDK lifecycle and cloud deployment flow

Skills

Core tools for GPU, ML systems, and performance work.

Primary stack

  • C++
  • Python
  • CUDA
  • PyTorch
  • NVIDIA Nsight Systems
  • NVTX

Systems / Performance

  • C#
  • Profiling
  • Parallel Computing
  • Throughput Optimization
  • Bottleneck Analysis

ML / Data

  • scikit-learn
  • NumPy
  • pandas
  • Data Pipelines

Multiplayer / Runtime

  • Unity
  • Netcode for GameObjects
  • Server-Authoritative Systems
  • Multiplayer Networking

Supporting tools

  • Git
  • Docker
  • GitHub Actions
  • Azure Functions
  • Java
  • Matplotlib

Resume

Resume focused on projects, tooling, and measured engineering results.

View the resume page or open the PDF directly.

Contact

Connect for internships, engineering roles, and technical conversations.

Review project code, profiling results, and implementation details on GitHub, or connect on LinkedIn for recruiting outreach and resume requests.